
With spring comes change. Time to change your wardrobe, your flower beds and, potentially, the way you live and your housing situation. As the home shopping season heats up, we’re again compelled to tackle the classic housing question: To buy or to rent?
The decision whether to buy a home is difficult. It’s not just the many costs to consider – transaction costs, maintenance, property taxes and homeowners insurance, for starters – but also how those costs might be offset by tax benefits and growing equity. And there’s always alternatives to consider, too: How high are rents? If you’re not using your money as a down payment, what are you doing with it? If you were to invest that money instead, what would that do for your wealth relative to home equity growth? Ultimately, your decision should be premised on how long you think it will be until you want (or in bad times, need) to move again.
The Zillow Breakeven Horizon estimates the typical time it takes for the accruing costs of renting a home in a given area to exceed the costs of having purchased the same home. Renting and buying have long-established pros and cons: After large upfront costs, the out-of-pocket expenses associated with owning stabilize before being increasingly offset by growing equity (and remember, a home is a leveraged asset and while you may put as little as 3% down, you earn a return based on the full value of your purchase – so if you purchase a $200,000 house and home values are appreciating at 4% per year your return on investment during your first year of ownership would be $8,000, where as if you’d invested your 3% downpayment of $6,000 and earned a similiar return your ROI would be just $240). Renting allows you to potentially invest those same large upfront costs in stocks and bonds, but there’s no guarantee your rent won’t rise, and no share of your rental payments will return to you as equity.
The Breakeven Horizon uses simple assumptions about how local housing and national stock markets will evolve in the future. Much is unknown, of course, but even simple assumptions are powerful. Stronger expected home value growth, for example, can shrink the Breakeven Horizon considerably and make buying a home more advantageous, more quickly. On the other hand, more robust performance in the stock market, coupled with weaker home value growth, can conspire to lengthen the Breakeven Horizon and make renting a better option.
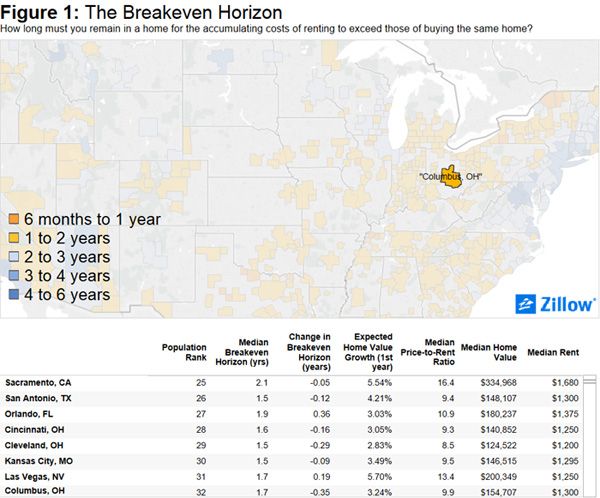
As of Q4 2015, the U.S. Breakeven Horizon is 1.9 years (slightly less than one year and 11 months). But real estate is local, and nobody seeks to move to “the United States” – we move to neighborhoods in cities within metro areas, so we calculate the Breakeven Horizon at those levels too.
Local market dynamics, including the pace of rental and home value growth, have an important impact on the Breakeven Horizon and how it changes over time. General rules of thumb say that if you’ll only live in a home for a short time, it’s cheaper to rent. And in many cases – but not all – those rules hold true (depending on your definition of a “short” time frame). Buying a home often requires large upfront costs in the form of a down payment and closing costs, and investments over time in taxes and maintenance. But consider this: A landlord expects to make a profit after paying the mortgage, taxes, insurance, repairs and other expenses.
Apartment rents increased faster last year than at any time since 2007, a boon for landlords but one that has stoked concerns about housing affordability for renters. Average effective rents nationwide rose 4.6% in 2015. However, rents in general are flattening across the country and are expected to continue to stabilize, a factor that could lengthen the Breakeven Horizon somewhat as home values continue to grow. And condominiums – a common choice for young home buyers, especially in urban neighborhoods – have a longer Breakeven Horizon because of the added costs of condo association fees.
Per the graphic below, the median Breakeven Horizon in Columbus OH currently stands at 1.7 years, this assuming a home value growth rate of just 3,24% (per the January Housing Market Report, the average sales price of a home in January was up 5.9% over January 2015), expected long term value appreciation is estimated at 4.27%.
Methodology
Ownership surplus: The savings earned by a household since the original purchase by buying the property instead of renting and investing the original down payment and any other avoided costs of buying in the S&P 500. The ownership surplus is estimated as the difference between the accumulating net costs of renting, and the accumulating net costs of homeownership associated with the median valued property (single-family residences, condos and co-ops).
Accumulating net cost of homeownership: The annual costs of ownership are offset by equity growth and tax benefits. These net costs are summed from the beginning of the household’s purchase, and include:
- Home value appreciation, estimated using the Zillow Home Value Index.
- Transaction costs: 3 percent of home value at purchase, and 8 percent at sale.
- Mortgage payments: We assume a 30-year, fixed-rate mortgage on the median valued home, purchased with a 20 percent down payment and at the prevailing mortgage rate[1].
- Property taxes: We assume 1 percent of contemporaneous home value, annually.
- Maintenance and renovation expenses: Together, these are assumed to be 1 percent of home value at purchase, then growing annually with inflation (very few homeowners spend what amounts to an average of 1 percent annually on maintenance and renovations).
- Homeowners insurance: Assumed to be 0.5 percent of home value, annually.
- Tax benefit: A homeowner can deduct interest payments and local property taxes from federal income. We assume a tax rate of 25 percent and use historical standard deduction amounts to estimate the tax benefit from owning.
- Opportunity cost: The interest you could have earned by investing the difference in out-of-pocket costs above and beyond renting, like the down payment, in the S&P 500 instead of buying a home.
Accumulating net cost of renting: The costs of renting summed from the beginning of the household’s lease.
- We assume annual rent increases according to the Zillow Rent Index, chained back to 2000 using changes in reported rent from the decennial census and American Community Surveys.
- Renter’s insurance: Assumed to be 1.32 percent of annual rent.
[1] These assumptions include a home buyer purchasing a home with a 30-year, fixed-rate mortgage and a 20 percent down payment; and a renters earning 5 percent annually on investments in the stock market (unlikely in the current and near term market which has seen stock values drop by over 10%).
Why a Home is Still the Best Investment
Buyer Frequently Asked Questions
If you, or someone you know is considering Buying or Selling a Home in Columbus, Ohio please contact The Opland Group. We offer professional real estate advice and look forward to helping you achieve your real estate goals!
The Opland Group Specializes in Real Estate Sales, Luxury Home Sales, Short Sales in; Bexley 43209 Columbus 43201 43206 43214 43215 Delaware 43015 Dublin 43016 43017 Gahanna 43219 43230 Grandview Heights 43212 Hilliard 43026 Lewis Center 43035 New Albany 43054 Pickerington Powell 43065 Upper Arlington 43220 43221 Westerville 43081 43082 Worthington 43235
Connect with us ![]()
![]()
![]()
![]()