
As It Relates To Central Ohio’s Housing Market
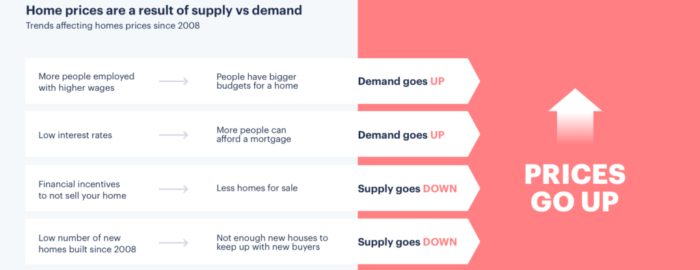
In 1890 English economist Alfred Marshall published his work, Principles of Economics in which he described how both supply and demand interact to determine price. Today, the supply-demand model is one of the fundamental concepts of modern economics. Rather simply the law predicts that the price level of any good or service will move toward the point that equalizes quantities supplied and demanded resulting in an economic equilibrium of price and quantity. Furthermore, it predicts that when supply exceeds demand, a surplus will exist.
How does this principle apply to the Real Estate Market in Columbus and Central Ohio. Well lets consider the Columbus and Central Ohio housing data from 2019.
Month – Total Listings – Listings Added – AVG Sales Price
•January – 3,818 – 2,181 – $208,512
•February – 3,613 – 2,249 – $220,694
•March – 3,626 – 3,228 – $232,169
•April – 3,883 – 3,711 – $242,063
•May – 4,,467 – 4,397 – $253,531
•June – 4,784 – 3,965 – $262,344
•July – 5,009 – 3,868 – $251,936
•August – 5,187 – 3,690 – $247,567
•September – 3,295 – 3,295 – $239,564
•October – 5,254 – 3,285 – $239,729
•November – 4,738 – 2,163 – $233,592
Buyer activity and thus demand for homes in Columbus and Central Ohio is highest between the months of April and June. This is also when we typically see inventory levels of homes available for sale begin to rise. This trend typically continues through June and July as many sellers how are looking to time their transaction will elect to put off listing their home until the kids are out of school. But as you can see from the data, home prices in Columbus Ohio actually peaked in June. This suggests that May was actually the best month of the year to sell a home in 2019 if you were looking to sell for top dollar and at the peak of the market as on average it takes 30 days to secure financing to fund their purchase.
But a single year certainly doesn’t define a trend and let’s consider years prior. In 2018 the average home price peaked in June at $262,344, in 2017 we witnessed the peak in May at $227,783, in 2016 it occurred in June at $216,379 and finally in 2015 it once again occurred in June at $206,061.
This average sales peaks almost always occur when demand is highest and just as the number of closed sales peak for the year. Occasionally this can be thrown of when a higher volume of luxury homes are sold in a given month which can serve to skew the average price up a bit.
As of today, January 19th, 2020 there are 3,413 homes listed in the Columbus Multiple Listing Service (MLS), and 2,748 pending sales. Very solid numbers, many parts of Central Ohio are currently in the middle of an inventory shortage with demand for homes in specific areas and price points exceeding supply.
While inventory levels are rising, they are rising fast enough in the areas and price points to meet the current level of demand. In spite of prices being up significantly, current inventory levels are less than 40% of our average over the last decade. The result, demand exceeds the current supply and as predicted by our economic model, prices are moving upward and towards a point that will eventually promote equilibrium. More to the point, the inventory of available homes for sale was down year over in year both October (-2.8%) and November (-4.6%) this as the average price of a home was up over 6% year over year.
The building industry typically works 2 to 3 years ahead, buying land and building speculative homes. This isn’t a problem as long as sales are consistent, however, that wasn’t the case over the past few years. Rather, after several down years developers postponed projects, while builders slowed or halted construction while they worked on selling off their existing inventories. While the builders are working to rebuild their inventories they have elected to focus in on specific price points leveling inventory shortages in those tiers they have neglected.
When builders are stuck with excess inventory, they typically attempt to attract buyers with offers of free upgrades or discounts in some cases as much as $10,000 to $40,000 off the price of an inventory home (depending on the price point of the home). That is builders attempt to adjust their price levels in an effort to equalize demand in their favor. As the inventory levels fall, builders find themselves under less pressure to sell and will begin to do away with these discounts and will eventually begin to raise their pricing as they have been doing in recent years.
Interest rates are another factor playing a significant role in the current real estate market. In an effort to help stabilize declining markets across the country, the government stepped in by reducing the Fed Funds Rate and injecting billions in liquidity into the market. The result, mortgage rates are down to their lowest levels ever, and the cost of financing a home has never been more affordable! With interest rates at these levels, many buyers simply can’t resist the opportunity to lock in financing at levels that are unlikely to be seen ever again!
So it is as Alfred Marshall’s Model predicts, demand has exceeded supply producing a market disequilibrium. While the market will soon correct itself, for the savvy seller there exists a window of opportunity to capitalize on this imbalance. That said, the current market with it’s historically low interest rates also presents an opportunity for buyers. In the stock market it’s the investment strategy of “buy low, sell high”. With inventory levels down, and prices may be up however, this low interest rate environment has muted this price increases making it a great time to buy a home. In short, it’s a fantastic time to buy, and/or sell a home in Central Ohio!
If you, or someone you know is considering Buying or Selling an Investment Property in Columbus, Ohio please give us a call and we’d be happy to assist you!
The Opland Group Specializes in Real Estate Sales, Luxury Home Sales, Short Sales in; Bexley 43209 Columbus 43201 43206 43214 43215 Delaware 43015 Downtown Dublin 43016 43017 Gahanna 43219 43230 Grandview Heights 43212 Galena 43021 Hilliard 43026 Lewis Center 43035 New Albany 43054 Pickerington 43147 Polaris Powell 43065 Upper Arlington 43220 43221 Westerville 43081 43082 Worthington 43235
Connect with us 


